Figure 1 provides a measure of the global unemployment rate based on data for 116 countries, of which 37 countries are classified as ‘advanced’ (i.e. high-income) countries and the remaining 79 as ‘emerging market and developing economies.’ (We refer to the second group using the acronym ‘EMDE’.)

Let’s begin with how the global unemployment picture looked before the IMF’s January 2016 WEO Update. Figure 1 provides a measure of the global unemployment rate based on data for 116 countries, of which 37 countries are classified as ‘advanced’ (i.e. high-income) countries and the remaining 79 as ‘emerging market and developing economies.’ (We refer to the second group using the acronym ‘EMDE’.) Focusing on the recent cycle, global unemployment rate peaked in 6.2 percent in 2009 and has since been returning slowly to its pre-crisis level. Over the coming year, the global unemployment rate is expected to go up slightly.
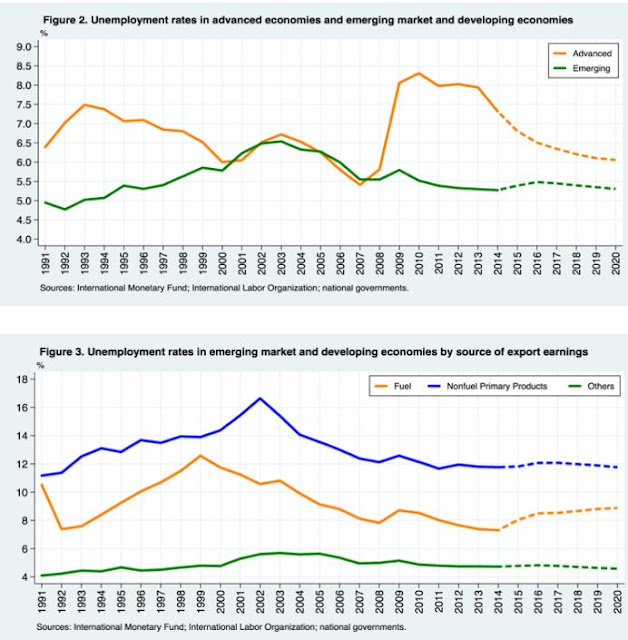
To understand where this increase is coming from, Figure 2 shows the unemployment rate for the two main groups of countries separately. This reveals that the increase comes from the emerging markets and developing countries (EMDE) group. Moreover, the increase in unemployment among this group occurs because of the expected increase in unemployment among fuelexporting countries (Figure 3).
How will the growth revisions affect the unemployment picture?
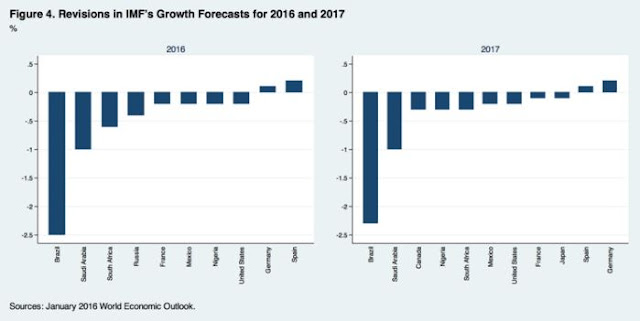
Now let’s consider how the revisions to the growth forecasts that the IMF announced in the January 2016 WEO Update could change the unemployment picture. At the global level, the forecast for GDP growth in 2016 was revised down by 0.2 percent, which would in turn increase the global unemployment rate only a little bit above the path projected in Figure 1. However, for some countries the revisions in growth forecasts are larger, as shown in Figure 4 below. The biggest change is in Brazil, followed by Saudi Arabia, South Africa and Russia.
Continue reading here.
The steady increase in China’s house prices at the national level masks tremendous variation at the city level, conference participants stressed in Shenzhen last month.
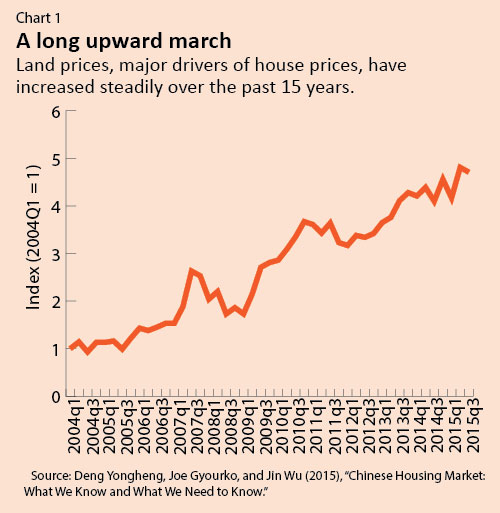
House prices in China have been on a long upward march over the past decade prompting questions about what the future holds (see Chart 1). At a conference last month in Shenzhen leading analysts of China’s housing markets provided some answers.
Organized by the IMF in cooperation with the Chinese University of Hong Kong, Shenzhen and Princeton University, the conference—International Symposium on Housing and Financial Stability in China—spotlighted new data sets on China’s housing markets, which provide informed views of what might happen next.
The conference was part of a series of conferences organized as part of the Global Housing Watch initiative, which also provides a quarterly update on conditions in housing markets. The latest update, released today, shows how China’s house price changes compare with those around the globe.
Demand-Supply Imbalances
Participants at the Shenzhen conference stressed that the steady increase in China’s house prices (see Chart 1) at the national level masks tremendous variation at the city level. Beijing has “experienced one of the greatest booms ever seen in housing markets,” according to real estate expert Joe Gyourko (University of Pennsylvania), but the situation is different elsewhere. With his co-authors, Gyourko has constructed a residential land price index for 35 large cities in China based on government sales of land to private developers. These data show that prices have increased in inflation-adjusted terms by about 80 percent a year in Beijing over the past decade but by only 10 percent a year in Xian (see Chart 2).
Continue reading here.
Kevin Drum--a political blogger for Mother Jones--asks: "But I wonder who did better at predicting recessions? Goldman Sachs? The CIA? A hedge fund rocket scientist in Connecticut? Whoever it is, it sounds like the IMF might want to look them up."
But as Drum noted in the Economist article, "Despite forecasters’ best efforts, growth is devilishly hard to predict".
Last year, in September, my presentation at the Federal Forecasters Conference summarized my work on the inability or unwillingness of forecasters to predict recessions. I suggested that to get forecasters to predict recessions (even inaccurately) we should have a Stekler Award for Courage in Forecasting. The award would be in honor of noted forecaster Herman Stekler who says that forecasters should predict recessions early and often and that he himself has predicted 9 of the last 5 recessions.
For my recent work on forecast accuracy see the following:
- September 2015: Fail Again? Fail Better? On the Inability to Forecast Recessions
- April 2014: “There will be growth in the spring”: How well do economists predict turning points?

Please bear in mind that this is intended to be a summary of views of external analysts and should not be attributed to the IMF.
“12 months of growing crisis”—that’s how the Guardian summarizes the housing market developments of 2015. This could partly explain the recent housing market measures announced by the UK government. However, experts doubt that these measures will have any effect. What follows is an attempt to answer four key questions about these developments:
- What are the new policies that the UK government announced?
- Will house price head north or south?
- What can be done?
- What are the likely implications?
1. What are the new policies that the UK government announced?The short answer: a series of measures to ease house prices and boost the housing supply.
The long answer: in November, the UK government announced three new policies for the housing market in its joint Spending Review and Autumn Statement. First: a new Help to Buy equity loan scheme for London will give buyers 40 percent of the home value from early 2016, as opposed to 20 percent. Second: help people get on the housing ladder through Help to Buy: Shared Ownership scheme. Third: from April 2016, people purchasing additional properties such as buy to let properties and second homes will pay an extra 3 percent in stamp duty. Moreover, in January, the House of Commons approved additional measures to boost housing construction.
2. Will house prices head north or south?
The short answer: north.
The long answer: “Government initiatives to support home ownership and build new houses will fail to have any real impact in 2016, with UK property prices expected to keep climbing”, according to a recent Financial Times survey. The survey asked 88 economists the following question: What effect are government policies likely to have on the housing supply and demand in 2016? How much will they contribute to likely changes in house prices?
The result of the survey is consistent with other data showing a similar upward trend in house prices. According to another survey, there is a pick-up in both activity and price expectations reflecting a rush to purchase Buy To Let properties ahead of the change in the Stamp Duty in April, according to Simon Rubinsohn at Royal Institution of Chartered Surveyors. Moreover, “The housing market has enjoyed some smooth sailing in the past year, with a steady 6.6% growth in house prices during 2015 (…) If the current speed of house price growth continues into 2016, the value of the average home may soon pass the £300,000 watermark, having reached £250,000 in December 2013”, according to LSL Property Services/Acadata. The latest numbers from Halifax, Knight Frank, and Office for National Statistics also points to an upward trend in house prices.
3. What can be done?
The short answer: it is complicated.
The long answer: on one hand, there seems to be a consensus among the experts that rising house prices is a concern and that there is not enough housing supply. On the other hand, there doesn’t seem to be any consensus on what the best way is to deal with rising house prices and expanding the supply of housing.
For example, experts have different views on how to address the housing supply problem. Martin Wolf of the Financial Times proposes that “The government must slay the sacred cows — the greenbelts around cities being the holiest of all.” In contrast, “Building an extra 100,000 houses a year would make hardly any difference to the upward trajectory of prices,” according to Gordon Gemmill of the University of Warwick. Oliver Jones of Fathom Consulting says: “(…) the problem in the UK is not a shortage of supply, but an excess of demand (…)”. The Economist says: “Building more houses is only part of the remedy for high prices (…) For one thing, Britain is bad at putting houses where they are most needed.” Melanie Baker and Jacob Nell of Morgan Stanley say that “There are so many government policies on housing that it is difficult to be confident about the net impact.”
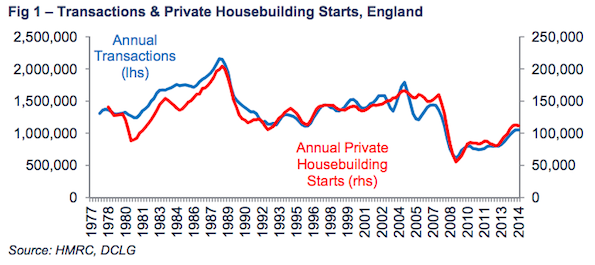
The complexity of the housing supply debate can also be seen in the chart above. It comes from Neal Hudson, of Savills, and reveals a bizarre relationship. It says: “This chart has big implications. Everyone goes on about how Britain needs to build 250,000 or so houses each year to keep up with demand. The chart, of course, implies that unless you get housing transactions up, private builders won't get anywhere near that figure (the public sector build very little housing). Now, the big question is: why does this relationship exist? Economists don't really know. However, here is one suggestion (…) Housebuilders, (…) tend to target the price of new-build houses at the upper decile of the prices prevailing in the local property market (ie, at the top 10% of all the houses sold nearby in a given period of time). If that is true, then you would expect there (roughly) to be one house built for every ten sold.”


